I will cover how to debug languages (PHP, JavaScript) and CMS that I use with VSCode, Edge, Xampp, xDebug and other diagnostic tools as required.
These instructions might not be the most complex but they will explain the basics allowing you to get started without pulling your hair out. I find when you have a soft start you are able to pick the more complex concepts easier, and more crucially, on your own.
While I will concentrate on using Edge as my browser there will be a lot of cross over to Firefox and Google Chrome, especially between Edge and Chrome as they are both based on the Chromium browser.
VSCode / Common
Tutorials
- Debug code with Visual Studio Code | VSCode - One of the great things in Visual Studio Code is debugging support. Set breakpoints, step-in, inspect variables and more.
- Mastering the Debug Console in VS Code: A Complete Guide - Toxigon - Learn how to use the debug console in VS Code with this comprehensive guide. From setting up launch configurations to using breakpoints and inspecting variables, we've got you covered.
General
- How do I add a breakpoint?
- Select a line and press f9
- When you hover over a line you will see a greyed out red ball, click here to add a breakpoint, not on the line number
- Search or filter debug variables in the various debug panels
- When you have the cursor in the relevant panel, you can press any key and the highlight row will move to the first record starting with that character (i.e.: a,b,c,d,$)
- If you press
F3(orCTRL+ALT+F), a search menu will appear. You can then search or filter for a variable or it's value. - Both the methods above work for the various debug panels, not just for variables.
- Where can I see Debug Variable values
- Variables View
- Watches View
- Hover over a variable in the code
- Inline (if enabled)
- Notes:
- Execution must be paused by a breakpoint for these to work.
- The hover method parses
\nas a new line where as the View method.
- Display Debug Variables Inline
- When enabled, the runtime variables found by the debugger will be displayed inline with your code. This setting does not affect the popup action when you hover over a variable or the Watches and Variables Views.
- To enable:
- Add the following to your
settings.json"debug.inlineValues": true
- Settings --> Debug --> Debug: Inline Values
- Add the following to your
- VS Code tips - Debug: inline values - YouTube | Code 2020
- With
Debug: Inline Values, VS Code shows the runtime value of variables directly in the editor while debugging - This makes is easier to understand your program’s current state and how it ended up there.
- With
- Resize the Debug Hover Widget (Hover Tooltip, Hover Tooltip Popup, Hoverbox, Hover Popup, Modal Popup, Debugger Tooltip)
- Q: In vscode I use Xdebug and on the right it has a variables view where you can see the variables for debugging. When you hover over a variable, a modal popup appears, how can I make this modal popup larger?
- A
- In Visual Studio Code when debugging with Xdebug (or any debugger). Unfortunately, VS Code doesn’t provide a built-in setting to directly resize or scale that hover popup.
- The hover popup does have scroll bars and will expand as needed i.e. you expand an array.
Troubleshooting
- Debug buttons are not showing? how to fix?
- Run --> Start Debugging
- All debug stuff is under the run menu
JavaScript (Edge)
Read the Console
This might sound obvious, but there is always information in the browsers console.
Examine the console for errors, warnings and notifications.
Output to the Console / console.log()
You can use console.log() to output all sorts of information about variables, functions, classes and results into the console, although you might find using debugger easier for this. A console.log() can be used to output different messages depending on the result of a calculation or function and so on. For instance you would have a console.log() for success and one for failure.
- Put one of the following in your JavaScript, selecting the sort of output you want.
### This will output the value `12345678` stored in the variable (`abc`) to the console var abc = 12345678 console.log(abc); ### This will output the text `This is a message` to the console console.log('This is a message'); ### This will output `123` to the console console.log(100 + 23); ### This will output the specified function (debounce) as text to the console. Useful to see if the function is defined console.log(window.debounce); Example Output: ƒ debounce(func, timeout = 300) { let timer; return (...args) => { clearTimeout(timer); timer = setTimeout(() => { func.apply(this, args); }, timeout); }; } - Run your code / Load the page
- Read the console
- Examine the console for notifications.
Debugging using the Sources Tab in DevTools
This is the traditional method of debugging using your browser and is usually JavaScript debugging as it is the browser (Client Side) that executes the code.
Notes
- JavaScript References
- JavaScript | MDN
- JavaScript (JS) is a lightweight interpreted (or just-in-time compiled) programming language with first-class functions.
- While it is most well-known as the scripting language for Web pages, many non-browser environments also use it, such as Node.js, Apache CouchDB and Adobe Acrobat.
- JavaScript is a prototype-based, garbage-collected, dynamic language, supporting multiple paradigms such as imperative, functional, and object-oriented.
- Standard built-in objects - JavaScript | MDN - This chapter documents all of JavaScript's standard, built-in objects, including their methods and properties.
- JavaScript | MDN
- Tutorials
- Common
- JavaScript Debugging - W3Schools offers free online tutorials, references and exercises in all the major languages of the web. Covering popular subjects like HTML, CSS, JavaScript, Python, SQL, Java, and many, many more.
- Javascript Debugging Best Practices | by GrooTech | Bits and Pieces - In this article, we will look at the ways we can debug a Javascript code. The good thing is that all modern browsers are shipped with a built-in JavaScript debugger.
- Edge
- Get started debugging JavaScript - Microsoft Edge Developer documentation | Microsoft Learn
- Learn how to use Microsoft Edge DevTools to find and fix JavaScript bugs.
- Pause code with breakpoints - Microsoft Edge Developer documentation | Microsoft Learn
- Get started debugging JavaScript - Microsoft Edge Developer documentation | Microsoft Learn
- Chrome
- Chrome DevTools | Chrome for Developers - Debug and optimize your web applications with Chrome DevTools.
- Pause your code with breakpoints | Chrome DevTools | Chrome for Developers
- Learn about all the ways you can pause your code in Chrome DevTools.
- Debugging JavaScript - Beginner to Advanced in One Video - YouTube | youwebdev
- Debugging Javascript - 0 (Beginner) to Heisenberg (Advanced)
- This presentation takes you from beginner to advanced javascript debugging using Chrome developer tools, jsHint, and custom tools.
- How to Use Developer Tools to Debug JavaScript in the Browser | freeCodeCamp
- The console object is the number one go-to for developers when working with buggy JavaScript code.
- But if you still rely heavily on the console object alone to debug your JavaScript, then you're missing out on some amazing browser developer tools features.
- Let's take a look at how you can debug JavaScript with the Chrome developer tools.
- Firefox
- Firefox Developer Tools | Mozilla
- Debugger PlayGround | Introduction | Mozilla
- Still using console.log for debugging JavaScript? There is a better way! Learn how to use Firefox Debugger to debug and fix your code.
- The Firefox JavaScript Debugger — Firefox Source Docs documentation - A debugger overview.
- Web Console — Firefox Source Docs documentation
- Console messages — Firefox Source Docs documentation
- Set watch expressions — Firefox Source Docs documentation
- Debugger.Object — Firefox Source Docs documentation
- Debugging Variables With Watchpoints in Firefox 72 - Mozilla Hacks - the Web developer blog
- Have you ever wanted to know where properties on objects are read or set in your code, without having to manually add breakpoints or log statements? Watchpoints are a type of breakpoint that provide an answer to that question.
- Examine, modify, and watch variables - Firefox Developer Tools - When the code has stopped at a breakpoint, you can examine its state in the variables pane of the debugger.
- Debug JavaScript in Firefox in 7 easy steps · Raygun Blog - Need to debug JavaScript in Firefox? Simply follow these 7 steps. Includes examples. Read our debugging guide now.
- 5 Tips and Tricks for Firefox DevTools - JavaScript Debugger - This article shows you 5 tips & tricks for working with the JavaScript Debugger in the Firefox Developer Tools.
- Common
- DevTools things
- Using Breakpoints
- Load the webpage into Edge (use CTRL + F5 to make sure the fresh JS is loaded)
- Developer Tools --> Sources
- Navigation the external JS file you want to add breakpoints to
- Add breakpoints
- To use the breakpoints, utilise the pause/play button section to control how they are used.
- Using debugger;
- Using
debuggerfrom your code to pause on that line is equivalent to a line-of-code breakpoint, except that the breakpoint is set in your code, not in the DevTools UI. - Instructions
- Put the following code in your JavaScript where you want execution to be paused. I do not remember if the semi-colon is mandatory.
debugger;
- Open the browsers console
- You need the console/DevTools open on the sources tab for debugging to trigger.
- Run your code / Load the page
- The debugger should open automatically.
- Read the Data
- Examine the console for errors, warnings and notifications.
- Hover over the variable and functions and see their values.
- Where you find the
$thisvariable, hover over it and it will show you all of the relevant variables
- Put the following code in your JavaScript where you want execution to be paused. I do not remember if the semi-colon is mandatory.
- Using
- Using Breakpoints
- Monitor JavaScript
- Visual Event
- Events in Javascript are often seen as a bit of an enigma.
- This is odd given that Javascript is very much an event driven language, but it is typically down to their complex nature and difficulty to debug.
- To this end I've created Visual Event to help track events which are subscribed to DOM nodes.
- Allan Jardine | Reflections | Visual Event
- Allan Jardine | Reflections | Visual Event 2
- GitHub - DataTables/VisualEvent: Visually show Javascript events on a page · GitHub
- Set event listener breakpoints — Firefox Source Docs documentation
- Debugging an application that includes event handlers can be done by automatically breaking when the code hits an event handler.
- This article explains how to use it.
- Visual Event
Edge DevTools shows Array(0) not Live Data - DevTools Array Inspection
Using this code as our example:
var chartDataDataset = _(timeScaleSegments).map(function(timeScaleRange, timeScaleIndex){ return countsPerTimeScaleIndex[timeScaleIndex] || 0; }).value();
In Edge DevTools, I can use debugger; to stop JavaScript and then examine the variables and objects. When I look at the chartDataDataset, DevTools shows Array(0) but DevTools knows that it has 3 arrays in it.
How do I use DevTools to Get a Live Reference so I can see these arrays in this object/array?
Explanation
You're encountering a common behaviour in DevTools (including Edge and Chrome) where objects like arrays show as Array(0) at first glance — especially when the data is lazy-loaded or the object is logged in a way that doesn't immediately expand its contents.
So, when you pause in the debugger and hover or inspect an object such as chartDataDataset, DevTools might show:
Array(0)
This often happens when:
- The array is created very recently, and DevTools evaluated it before it was populated.
- You're looking at a snapshot rather than a live reference.
- The array contains complex or nested structures, and it wasn't expanded at the right time.
Solutions: How to See the Actual Data
Here's several methods on how to see the full data, the live snapshot, which will show the "hidden arrays" in DevTools.
Log It After It's Created
- Right after
chartDataDatasetis defined, add:console.log(chartDataDataset);
- Then expand the array in the Console — this shows a live reference, not a snapshot.
Use the Debugger Step-by-Step
- Set a
debugger;statement after the line wherechartDataDatasetis defined:var chartDataDataset = _(timeScaleSegments) .map(function(timeScaleRange, timeScaleIndex){ return countsPerTimeScaleIndex[timeScaleIndex] || 0; }) .value(); debugger; - In Edge DevTools, go to the "Scope" section while paused.
- Find
chartDataDatasetin the "Local" variables. - Expand it — now you should see the correct length and its items.
Use Console to Manually Inspect
It still says Array(0):
- Go to the Console tab.
- Type
chartDataDatasetand press Enter. - Now inspect the expanded structure manually.
Use JSON.stringify() if Needed
This won't work well if it contains circular references, but it's useful for flat data.
- Use the following in your code:
console.log(JSON.stringify(chartDataDataset, null, 2));
Use the Watch panel (semi-live)
While not fully "live", this lets you re-evaluate on demand as you continue stepping.
- Go to the Sources tab.
- While paused at a debugger; or breakpoint, add
chartDataDatasetto the Watch panel. - This updates as you step through code.
Use $0, $1, etc. or inspect variables in Console
You can select an object in the Elements or Scope tab and reference it in Console using:
$0(currently selected object)$1,$2for previous ones
Or, just manually type chartDataDataset into the Console after it’s defined. That always evaluates it in real-time.
Additional Notes
- What Doesn't Work for Live Viewing
- Expanding the object in the Scope or Call Stack sidebar sometimes shows a snapshot, not a live object.
- If you hover over the variable name, the tooltip can be stale.
- Logging and immediately expanding while paused may not reflect later mutations.
- Pro Tip: Freeze Object Snapshot
- If you right-click a logged object in Console, you can choose “Store as global variable” (e.g., temp1).
- This lets you inspect it freely in the Console, and it won’t change unless you reassign it.
PHP (Core) - might move
- How do I get PHP errors to display? - Stack Overflow
- This always works for me:
ini_set('display_errors', '1'); ini_set('display_startup_errors', '1'); error_reporting(E_ALL); - However, this doesn't make PHP to show parse errors that occurred in the same file. Also, these settings can be overridden by PHP. In these cases the only way to show those errors is to modify your php.ini (or php-fpm.conf) with this line:
display_errors = on;
- This always works for me:
PHP (Xdebug)
Software Needed
- VSCode
- Xampp
- Xdebug binary
- Xdebug VSCode plugin
- Browser Plugins
- Edge
- Xdebug Helper by JetBrains - Microsoft Edge Add-ons
- Options: Debug, Profile, Trace, Disable.
- Can set custom IDE key
- Xdebug helper - Microsoft Edge Add-ons - I use this one.
- Options: Debug, Profile, Trace, Disable.
- Can set custom IDE key
- Xdebug Helper by JetBrains - Microsoft Edge Add-ons
- Firefox
- Xdebug Helper by JetBrains
- Options: Debug, Profile, Trace, Disable.
- Can set custom IDE key
- Xdebug Helper for Firefox
- Adds an icon into the address bar.
- Cannot pin it to the toolbar.
- Options: Debug, Profile, Trace, Disable.
- Can set custom IDE key
- Xdebug Helper by JetBrains
- Edge
Config Files
Below are the xDebug configurations I use.
My VSCode Config
- This lives in
launch.json - In VSCode, if you hover over these settings, intellisense will show you more information. Might require the Xdebug extension to be installed.
"launch": {
    "configurations": [
        {
            "name": "Listen for XDebug",
            "type": "php",
            "request": "launch",
            "port": 9003,
            "xdebugSettings": {
                "max_children": 128,
                "max_data": -1,
                "max_depth": 3
            },
        },
        {
            "name": "Launch currently open script",
            "type": "php",
            "request": "launch",
            "program": "${file}",
            "cwd": "${fileDirname}",
            "port": 9003,
            "runtimeExecutable": "D:\\websites\\php\\php.exe"
        }
    ]
},
An Alternative VSCode Config
I have not used this, it is just for reference because I do not understand the additional options.
{
    "name": "Launch Built-in web server",
    "type": "php",
    "request": "launch",
    "port": 9003,
    "program": "",
    "cwd": "${workspaceRoot}",
    "runtimeArgs": [
        "-dxdebug.mode=debug",
        "-dxdebug.start_with_request=yes",
        "-S",
        "localhost:0"
    ],
    "env": {
        "XDEBUG_MODE": "debug,develop",
        "XDEBUG_CONFIG": "client_port=${port}",
        "XDEBUG_TRIGGER": "VSCODE"
    },
    "serverReadyAction": {
        "pattern": "Development Server \\(http://localhost:([0-9]+)\\) started",
        "uriFormat": "http://localhost:%s",
        "action": "openExternally"
    }
    "pathMappings": {
                "/srv/www/mywebsiteroot": "${workspaceRoot}",
                "/app/": "${workspaceRoot}"
    },
    "stopOnEntry": true,
    "log": true
}
php.ini Config
- This has annotations to make editing the config easy.
- I always put this at the end of the file.
- If you want to use Xdebug and OPCache together, you must have the
zend_extensionline for Xdebug below the line for OPCache, or in a file starting with a higher number (ie. 99-xdebug.ini vs 20-opcache.ini), otherwise they won't work properly together. - Page not found - Stack Overflow - Stack Overflow | The World’s Largest Online Community for Developers
zend_extension = xdebug- TL;DR it is an alias call and is not needed if you call a DLL directly.
- This allows you to swap the DLL file without having to change the
php.iniwhen you upgrade PHP etc... - Why do I need `zend_extension = xdebug`? (Staging) | Stack Overflow
- read few lines below zend_extension=xdebug. There is:"If Xdebug does not show up, or you get a warning from PHP that an xdebug.so file or similar was not found, you might need to use the full path instead of just zend_extension=xdebug, such as zend_extension=/usr/lib/php/20190902/xdebug.so.". Maybe wizard checks only if you have zend_extension = xdebug. So if it works with full path then don't bother this.
- php - Why do I need `zend_extension = xdebug`? - Stack Overflow
[XDebug v3]

; https://xdebug.org/
; https://xdebug.org/docs/all_functions
; https://xdebug.org/docs/all_settings
; https://xdebug.org/docs/upgrade_guide - (V2 -> V3) including replacements
; https://xdebug.org/docs/develop
; https://xdebug.org/docs/errors

;;;; Binary Location

; Download here: https://github.com/xdebug/xdebug/releases
; Xampp uses: 64-bit Thread Safe, for this version of PHP
; Example file explained : php_xdebug-3.5.1-8.2-ts-vs16-x86_64.dll
;   3.5.1  = xDebug Version
;   8.2    = Target PHP version
;   ts     = Thread Safe / nts = Not Thread Safe
;   vs16   = Visual Studio version used to compile the DLL
;   x86_64 = Supported Archietecture
; Thread Safe vs Non Thread Safe
;   https://stackoverflow.com/questions/5793751/what-are-the-technical-differences-between-the-thread-safe-and-non-thread-safe-p
;   If you're running Apache (or IIS) as FastCGI (or CGI) then you want the Non Thread Safe version of PHP.
;   If you're running Apache as default (as a Module), then you'll want the more traditional Thread Safe version.
; Direct dll call
zend_extension = "D:\websites\php\ext\php_xdebug-3.5.1-8.2-ts-vs16-x86_64.dll"
; Alias call
;   Download php_xdebug-3.5.1-8.2-ts-vs16-x86_64.dll
;   Rename it to php_xdebug.dll
;   Move the downloaded file to D:\websites\php\ext
;   Use this call method below instead of the direct dll call.
;zend_extension = xdebug

;;;; Connection Settings

xdebug.mode = debug,develop
    ; https://xdebug.org/docs/all_settings#mode
    ; debug is needed for step debugging
    ; develop is needed to show orange `Call Stack`
    ; https://stackoverflow.com/questions/67274848/xdebug-3-not-showing-stack-trace-on-fatal-error-since-upgrading
xdebug.client_host = thebrain
    ; Can use an IP here but hostname is better
xdebug.client_port = 9003
    ; default port: 9003
xdebug.idekey = "vsc"
xdebug.file_link_format = "vscode://file/%f:%l"
    ; Clickable Stack Traces
    ; xdebug.file_link_format = "netbeans://open/?f=%f:%l"
    ; IDE Links stack traces and errors - https://xdebug.org/docs/all_settings#file_link_format - Read the Readme

;xdebug.start_with_request = yes
    ; The functionalit starts when the PHP request starts, and before any PHP code is run.
    ; I do not use this because i use a browser plugin
    ; https://buildio.dev/xdebug-and-its-impact-on-performance-xampp/
    ;  It instructs XDebug to start a debugging session at the beginning of every PHP request.
    ;  This means that XDebug will be active for all PHP executions, whether they are accessed through a web browser, CLI, or any other method that invokes PHP.

;xdebug.start_upon_error = yes
    ;Xdebug will trigger a debugging connection when a PHP Notice or Warning appears, or when a Throwable (Error or Exception) is thrown.
    ; This will be intiated by the browser, i think you have to have netbeans waiting in debug mode

;;;; Logging

; All warnings and errors also show up in the diagnostics log that you can view by calling xdebug_info().
; All data is appended

;xdebug.log = "D:\websites\tmp\xdebug\xdebug.log"
    ; https://xdebug.org/docs/all_settings#log_level
xdebug.log_level = 7
    ;controls how much information is logged.

;;;; Remote

;xdebug.remote_autostart = 0
    ; This must be off otherwise curl_exec() will crap out the debugger - dont know about V3
    ; ?? https://xdebug.org/docs/all_settings#start_with_request
;xdebug.remote_mode = req

;;;; General

;xdebug.collect_return = off
;xdebug.max_nesting_level = 100
    ; For Gantry - https://docs.gantry.org/gantry5/troubleshooting/max-nesting-level use 256
;xdebug.show_exception_trace = 1
    ; When this setting is set to 1, Xdebug will show a stack trace whenever an Error is raised - even if this Error is actually caught.
;xdebug.show_local_vars = 1
    ;This shows local variables in the stack trace
    ;https://xdebug.org/docs/develop
;xdebug.var_display_max_data = 16384
;;NOT in V3 - I Need to find the equivalent
    ;xdebug.auto_trace = off
    ;xdebug.collect_includes = on
    ;xdebug.collect_params = off
    ;xdebug.default_enable = on
    ;xdebug.extended_info = 1
    ;xdebug.manual_url = http://www.php.net
    ;xdebug.show_mem_delta = 0

;;;; Trace options

;xdebug.trace_options = 0
    ; When set to '1' the trace files will be appended to, instead of being overwritten in subsequent requests.
;xdebug.trace_format = 0
;xdebug.trace_options = 0
;xdebug.trace_output_name=crc32
; NOT in V3 - I Need to find the equivalent
    ;xdebug.trace_output_dir= "d:\websites\tmp\xdebug\trace"

;;;; Profiling - https://xdebug.org/docs/profiler

;xdebug.xdebug.profiler_append = 0
;xdebug.profiler_output_name = cachegrind.out.%p
    ; or "cachegrind.out.%t-%s"
; NOT in V3 - I Need to find the equivalent
    ;xdebug.profiler_aggregate = 0
    ;xdebug.profiler_enable = 0
    ;xdebug.profiler_enable_trigger = 0
    ;xdebug.profiler_enable_trigger_value = ""
    ;xdebug.profiler_output_dir = "D:\websites\tmp\xdebug\profiler"

;;;; Value Dumping

;https://xdebug.org/docs/all_settings#dump.*
;xdebug.dump.SERVER = REMOTE_ADDR,REQUEST_METHOD
;xdebug.dump.GET = *
;xdebug.dump_undefined=1
Xdebug
Office Sites
- Xdebug.org - Xdebug: A Debugger and Profiler Tool for PHP
- GitHub - xdebug/xdebug: Xdebug - Step Debugger and Debugging Aid for PHP.
- Releases · xdebug/xdebug · GitHub - Download files here.
- XDEBUG - File and System Debugger | SourceForge.net
- Newest 'xdebug' Questions - Stack Overflow - For questions regarding Xdebug,
- Xdebug - Bug Tracker - If you think that you encountered a bug, please file a detailed bug report here.
- Xdebug: Support - Tailored Installation Instructions - This page helps you finding which file to download, and how to configure PHP to get Xdebug running.
Official Docs
- Xdebug: Documentation
- Xdebug: Documentation - All functions
- Xdebug: Documentation - All settings
- Xdebug: Documentation - Upgrading from Xdebug 2 to 3
- Xdebug: Documentation - Description of errors
- Xdebug: Documentation - All related content - YouTube Videos
- Xdebug: Documentation - Supported Versions and Compatibility - This page lists which versions of Xdebug are still supported, and with which versions of PHP they can be used.
- Xdebug: Project: Native Xdebug Path Mapping
General
- PHP-FPM and clear_en
- Some web servers have a configuration option to prevent environment variables from being propagated to PHP and Xdebug
- For example,
PHP-FPMhas aclear_envconfiguration setting that isonby default, which you will need to turnoffif you want to useXDEBUG_CONFIG. - Make sure that your web server does not clean the environment, or specifically allows the
XDEBUG_CONFIGenvironment variable to be passed on. - From https://xdebug.org/docs/all_settings
- Should I disable `output_buffering`
- Whether you need to disable output buffering for Xdebug depends on what you're trying to do and which Xdebug feature you're using.
- When Output Buffering Matters with Xdebug
- For step debugging (breakpoints, stack traces): Output buffering typically doesn't affect the debugger itself. Xdebug's step debugging communicates with your IDE via a separate network protocol (DBGp), so buffered output doesn't interfere. You can leave output buffering enabled.
- For error handling and stack traces: If you're relying on Xdebug to display error stack traces in the browser, output buffering can sometimes cause issues because the trace needs to be sent before any other output. However, this is rarely a problem in practice.
- For the profiler or code coverage features: Output buffering has no impact on these features. They operate independently of output.
- When You Might Want to Disable It
- Early fatal errors: If a fatal error occurs very early in your script (before output buffering is flushed), you might miss Xdebug's error output. Disabling buffering ensures error information displays immediately.
- Streaming responses: If you're working with streaming or chunked output, output buffering can interfere with your ability to see real-time data.
- Debugging output order: If you're debugging and want to see exactly when output happens in relation to code execution.
- General Recommendation
- Leave output buffering enabled for normal development. Xdebug works fine with it.
- If you encounter specific issues (missing error traces, unexpected behaviour), you can temporarily disable it to test: just set
output_buffering = Offin yourphp.inior useob_end_flush()in your code.
- How to have XDebug send log entries to VS Code 'Debug console' window?
- php - How to have XDebug send log entries to VS Code 'Debug console' window? - Stack Overflow
- If you set your PHP
error_logsetting to syslog and PHP will send all error log messages to stderr, which Xdebug will then send to the IDE. - Xdebug itself does not send
error_logmessages to the IDE, but there is now anxdebug_notify()function, with which you can send messages (strings, and variables) to the IDE as well. xdebug_notify()works, thank you! However, settingerror_logto syslog inphp.ini, restarting Apache, then issuingerror_log("test"); in PHP (8.2) does not work for me.- I am using
php_xdebug.dll 3.2.0.11.
- If you set your PHP
- php - How to have XDebug send log entries to VS Code 'Debug console' window? - Stack Overflow
- Show Full Variable Content in the VSCode View
- In this section I will address how to setup your Xdebug View to present variable information correctly.
- Xdebug Variable Full Content in VSCode | Praveen Dias
- The below configuration adjustments are necessary to enhance the debugging process within Visual Studio Code when utilizing xdebug. By specifying an increased
“max_children”value and enabling unlimited“max_data,”developers can obtain more comprehensive insights into complex data structures and object hierarchies during debugging sessions. Additionally, the limitation imposed on“max_depth”to a value of 3 prevents excessive recursion depths, striking a balance between thoroughness and performance."xdebugSettings": { "max_children": 128, "max_data": -1, "max_depth": 3 }
- The below configuration adjustments are necessary to enhance the debugging process within Visual Studio Code when utilizing xdebug. By specifying an increased
- Variable truncation in the VSCode View
- This can be annoying when you just what to see the full variable. The following will remove the character limit and thus the truncation. You can also just set a higher arbitrary limit such as
512. - Goto the Xdebug settings in your VSCode
launch.json - Add
"max_data": -1into yourxdebugSettings:"xdebugSettings": { "max_data": -1 },- I usually put the
xdebugSettingsbelow theportdeclaration if it does not exist.
- I usually put the
- This can be annoying when you just what to see the full variable. The following will remove the character limit and thus the truncation. You can also just set a higher arbitrary limit such as
- Can't view the full content of string variables with more than 512 characters in VS Code XDebug Debug Console · Issue #815 · xdebug/vscode-php-debug · GitHub
- Q:
- You will see only the first 512 characters, instead of the full string value.
- For XDebug there is a special setting, that can extend this limit to more than 512 characters: https://xdebug.org/docs/all_settings#var_display_max_data
- But even if I set it to higher values or use
-1- it doesn't resolve the issue:ini_get('xdebug.var_display_max_data') "4096"
- A:
- The maximum length to be transferred in a debug session is controlled by settings set within the debug session. The INI settings do not control this.
- You need to set the
max_datain yourlaunch,json. See thexdebugSettingssection in the README. - I would like to have a special "details" window where I could fetch the whole data of a variable, but VSCode does not currently offer such a UI element.
- Q:
Debugging via the Command Line (CLI)
These all assume that Xdebug is setup correctly in php.ini
- Do one of the following
- Launch PHP with several switches: (can get to work)
php -d xdebug.remote_enable=1 -d xdebug.remote_mode=req -d xdebug.remote_port=9000 -d xdebug.remote_host=127.0.0.1 -d xdebug.remote_connect_back=0 path/to/script.php
- Set an environment variable that configures Xdebug:
set XDEBUG_CONFIG=remote_enable=1 remote_mode=req remote_port=9000 remote_host=127.0.0.1 remote_connect_back=0
- mine test: (nb: no spaces in the seperate statements, but 1 space between each)
php -d xdebug.remote_enable=on -d xdebug.remote_autostart=0 -d xdebug.remote_handler=dbgp -d xdebug.remote_mode=req -d xdebug.remote_host="192.168.1.226" -d xdebug.remote_port=9001 -d xdebug.remote_connect_back=0 -d xdebug.remote_log="d:\websites\tmp\xdebug\xdebug_remote.log" -d xdebug.idekey="vsc" cron.php
- Launch PHP with several switches: (can get to work)
- Other method (unverified)
- Run the following the command line
set XDEBUG_CONFIG="idekey=vsc"- works, i think this enviroment variable is temp)
unset XDEBUG_CONFIG- this deletes the variab
- Now
- open a cmd prompt and navigate to the folder with the script in it. You can run from anywhere but this makes it easier
- have netbeans debug ready
- Run:
set XDEBUG_CONFIG="idekey=vsc" - Run your script ie: php cron.php (in the folder with the script)
- Links
- Xdebug: Documentation - Command Line Debug Client - The command line debug client allows you to debug PHP scripts without having to set up an IDE.
- Starting a debugging session from the command line | PhpStorm Documentation - You can start debugging a PHP CLI script from the command line, having PhpStorm listen for incoming debugger connections.
Functionality
These sections cover the main functionality of Xdebug.
There are many ways to trigger debugging:
- $_GET
- $_POST
- $_COOKIE
- Always start with each request
- xdebug_break()
- xdebug_start_trace()
Step Debugging
- General
- Xdebug: Documentation - Step Debugging
- Analyse PHP code while it runs
- allows you to interactively walk through your code to debug control flow and examine data structures.
- A Detailed Guide to PHP Debugging - Stackify - In this detailed PHP debugging tutorial, you'll learn debugging techniques in order to become a bug exterminator extraordinaire!
- Xdebug: Documentation - Step Debugging
- Tutorials
- Learn How to Debug PHP with Xdebug and VsCode | Cloudways - Learn how to run PHP debug process with Xdebug & VsCode and find core application errors within minutes.
- Debug PHP using Xdebug and Visual Studio Code On Ubuntu | Tutorials24x7 - Master PHP debugging with Xdebug and Visual Studio Code on Ubuntu. Enhance your coding efficiency and resolve issues effortlessly with our expert guide.
- How to Debug PHP Using Xdebug On Vscode - DEV Community - Using VSCode and the PHP xDebug module, you'll enable full-featured functional debugging throughout your whole application.
- Learn How to Debug using Xdebugger with PHP & Visual Studio Code - Debugging is vital for developers to ensure the correctness of their code, especially when deadlines are close. Click to learn how to debug using Xdebugger and VSCode.
- Debug With Docker
- Debug with VSCode, Xdebug, and Docker on Windows - SoftwareDebug
- Setup Step Debugging in PHP with Xdebug 3 and Docker Compose | Blog - Matthew Setter
- In versions of Xdebug before version 3 setting up step debugging for code inside Docker containers has often been challenging to say the least.
- However, in version 3 it's become almost trivial. In this short tutorial, I'll step you through what you need to do, regardless of the (supported) text editor or IDE you're using.
Profiling
- General
- Xdebug: Documentation - Profiling
- Check your application for performance issues
- allows you to find bottlenecks in your script and visualize those with an external tool.
- Debugging and Profiling PHP with Xdebug | sitepoint - In this article you’ll see how to install and configure Xdebug, how to debug your PHP application from Netbeans, and how to read a profiling report in KCachegrind.
- Xdebug: Documentation - Profiling
- Software
- xdebug/contrib/online_profiling_prepend.php at master · xdebug/xdebug · GitHub - Online profiling dump
- xdebug profiler viewer - Visual Studio Marketplace - A extension to view xdebug profiler files.
- PHP Profiler - Visual Studio Marketplace - Support for PHP (Xdebug) profiling files and inspecting them.
- QCachegrind Download - Seiden Group
- Download QCachegrind for use with Xdebug to profile the performance of your open source applications and find where your application lags.
- Windows: Download on this page.
- Linux: `QCachegrind` is likely available in your system’s package manager as `KCachegrind`.
- KCachegrind - KDE Applications - Profiler Frontend
- WinCacheGrind
- Is a viewer for
cachegrind.outfiles generated by xdebug 2. - Is functionally similar to KCacheGrind, only it is much simpler and runs on Windows.
- Is no longer maintained.
- Is a viewer for
- GitHub - jokkedk/webgrind
- Xdebug Profiling Web Frontend in PHP.
- It implements a subset of the features of kcachegrind and installs in seconds and works on all platforms.
Function Tracing
- General
- Xdebug: Documentation - Function Trace
- Show every function call, assignment, and return value.
- Xdebug allows you to log all function calls, including parameters and return values to a file in different formats.
- Where does Xdebug save by default the files when using xdebug_start_trace() and xdebug_stop_trace()? - Stack Overflow
- Xdebug: Documentation - Function Trace
- Tutorials
- Using Xdebug to Trace Functions – AgileAdam.com - Here’s how Xdebug describes function tracing.
- Xdebug and tracing memory usage — Derick Rethans
- Recently people started to ask me how to use Xdebug to figure out which parts of applications use a lot of memory.
- Traditionally this was part of Xdebug's profiling functionality. Unfortunately the cachegrind format didn't fit this so well, and because it returned incorrect data I removed this functionality from the profiler.
- However, there is other functionality in Xdebug that does provide the correct data: the function traces.
- Software
- xdebug/contrib/tracefile-analyser.php at master · xdebug/xdebug · GitHub - Trace File Analyser
- GitHub - kuun/xdebug-trace-viewer - An Xdebug trace viewer build on electron.
- GitHub - chrisakers/Xdebug-Trace-Visualizer - A flame graph-style visualization for PHP Xdebug trace files
Flame Graphs
- General
- Xdebug: Documentation - Flame Graphs
- Visualise performance bottlenecks.
- Flame graphs are a special type of trace file that can be used to visualise performance metrics.
- Xdebug: Documentation - Flame Graphs
- Tutorials
- Xdebug 3.3: Flamegraphs - YouTube
- In this video I am showing how to create flamegraphs with Xdebug 3.3.
- The Perl script to create the SVGs can be found in the https://github.com/brendangregg/FlameGraph GitHub repository.
- An article version is available at https://derickrethans.nl/flamboyant-flamegraphs.html
- by the developer of Xdebug.
- Xdebug 3.3: Flamegraphs - YouTube
Development Helpers
- General
- Xdebug: Documentation - Development Helpers
- help you get better error messages and obtain better information from PHP's built-in functions.
- Xdebug's development helpers allow you to get better error messages and obtain more information from PHP's built-in functions. The helpers include an upgraded
var_dump()function; location, stack, and argument information upon Notices, Warnings and Exceptions; and numerous functions and settings to tweak PHP's behaviour.
- Xdebug: Documentation - Development Helpers
Code Coverage Analysis
- General
- Xdebug: Documentation - Code Coverage Analysis
- Analyse whether your tests cover your whole code base.
- Code coverage tells you which lines of script (or set of scripts) have been executed during a request. With this information you can for example find out how good your unit tests are.
- Xdebug: Documentation - Code Coverage Analysis
Troubleshooting
- 12 Most Common Xdebug Issues (and How to Fix Them) - DEVSENSE Blog
- A practical guide to the most frequent PHP debugging problems with Xdebug and IDE-integrated debuggers, and how to fix them.
- when xdebug does not work then: (These were formed when I was using Netbeans but should still be valid for VSCode.)
- Add a breakpoint to the first file that gets opens (i.e. index.php) and see if it works
- Make sure you set a static IP in your network controller
- Only have 1 active network controller
- Set the ip address in the php.ini to match
- `Path Mappings` are usually not needed but if they are add them. if they are there and dont work try removing them. thse should not change once you have things working
- check Netbeans is working and you could also turn on `options --> php-debugging --> stop at first line`
- verify where you have a breakpoint the pointer will actually hit.
- make sure the connection settings are correct
- use your computer name as connection host
- use the computers hostname ie
e6540as this stops things work if you are on a DHCP e6540.lanande6540.yourdomain.ukwill work if configured but will involve an external DNS lookup
- use the computers hostname ie
- For those having connection issues the 2 bug fixes are:
- Use your systems IP, do not use 127.0.0.1
- The Project's `Path mappings` in Netbeans sometimes need to be set.
Watches
Tutorials
- not php - Debugging in Visual Studio Code with Watches - YouTube | Dev Leader
- Using visual studio code (vs code) and wondering how you can make your debugging a little bit easier? Maybe you've heard of watches or watchpoints, but you're not familiar with how to use them? No sweat!
- This is a beginner level video that should help you see how you can easily pull up your watches in visual studio code and make your debugging easier!
- not php - How to Setup Watches to Debug Variables in Visual Studio - YouTube | Dev Leader
- Using visual studio and wondering how you can make your debugging a little bit easier? Maybe you've heard of watches or watchpoints, but you're not familiar with how to use them? No sweat!
- This is a beginner level video that should help you see how you can easily pull up your watches in visual studio code and make your debugging easier!
- https://josephmilliken.com/blog/vscode-inline-watch-expressions - website was down when doing this article
Notes
- This is very powerful debugging feature.
- if you right click on a variable you can add it to WATCH
- VS Code will break when the expression evaluates to true. You can also break when a value is false, just get the expression right.
- Remember it will only evaluate in the current frame (The Tokens, Values and Symbols available to the current page being debugged)
- You can conditionally look for variables with a watch, but they do not pause execution or allow you to go to where there were defined etc... probably becasue they can be at mulitple places or it is outside of the frame.
- Xdebug + VSCode can pause when a watch expression evaluates to true, but not directly.
- A watch in VSCode does not trigger a pause — it's only for observing values while already paused (e.g., at a breakpoint).
- If you want Xdebug to automatically pause when a variable equals
classic-doors.vm, you need to use a conditional breakpoint, not just a watch so to confirm, a breakpoint needs to be active which pause the execution.
- Why Watches Alone Don’t Pause Execution
- They only evaluate when execution is already paused (at a breakpoint or step).
- Are not triggers for a pause by themselves.
- Watch expressions are only valid in the current context/frame.
- You cannot Watch a whole class, just variables.
- You must manually add a watch expression. Static properties do not automatically appear in the Scope panel.
- Xdebug does not automatically list static properties in the “locals” section because they're not part of the current stack frame.
- You must explicitly watch/evaluate them.
- Static private properties can still be read by Xdebug — visibility rules do not apply in the debugger.
- Why you can’t “just watch the class” directly
- Xdebug shows locals, superglobals, and object properties in the current frame.
- Static properties are not part of the stack frame, so the IDE must manually request them.
- Most IDEs only request statics if you ask explicitly (via watch or evaluation).
- Why you cannot watch a class directly
- Xdebug’s debug protocol only allows watching variables, not types.
- A class is not a variable/value at runtime, so the IDE cannot fetch it automatically.
- The only way to pull information about a class is to evaluate code on demand — which is what the Reflection workaround does.
- Xdebug shows locals, superglobals, and object properties in the current frame.
- Static properties are not part of the stack frame, so the IDE must manually request them.
- Xdebug itself cannot auto-enumerate all static properties of a class — the debugger protocol doesn’t send them unless the IDE explicitly requests them. Most IDEs do not automatically fetch static properties, so you must use a workaround.
View Static Variables (Watch)
Static properties do not automatically appear in the Scope panel, you must add a Watch Expression to see the static variable such as:
$this::$variable
\CMSApplication::$VAR
Payment::$payment_details
PaymentMethodCreditnote::$creditnote_details
This then shows the values of it underneath just like in the variables part.
Other options (not tried)
- Declaring the class as a variable
$this->paymentMethod = new $Payment;
$chicken = new $Payment;
- Reference the static with an echo or another variable locally on your code so they appear as a local variable.
- Using Xdebug breakpoints + xdebug_info()
- If you put a breakpoint anywhere and call:
xdebug_info(); - Then open the debugger console, you can run:
print MyClass::$myStaticVar
- If you put a breakpoint anywhere and call:
- Using Xdebug’s function breakpoint and class filter
- If the static variable is modified inside a method of another class, set a breakpoint inside that method. Xdebug will pause, and the IDE will allow you to evaluate:
OtherClass::$theStatic
- If the static variable is modified inside a method of another class, set a breakpoint inside that method. Xdebug will pause, and the IDE will allow you to evaluate:
Alternative Methods - View Static Variables (Watch)
Here are all practical methods depending on what you want:
- Method 1: Use Reflection to dump all static properties
- Add a temporary debug line anywhere you have a breakpoint:
$ref = new ReflectionClass(MyClass::class);
$statics = $ref->getStaticProperties();
- Then inspect
$staticsin your debugger (it will appear as a normal array and expand cleanly). - This is the most reliable and IDE-agnostic way.
- Add a temporary debug line anywhere you have a breakpoint:
- Method 2: Use var_dump() (with Xdebug formatting)
- Inside a breakpoint:
var_dump((new ReflectionClass(MyClass::class))->getStaticProperties());
- Xdebug will pretty-print all static values.
- Inside a breakpoint:
- Method 3: Add a “Class” Watch Expression in IDE
- Most IDEs don’t show static values automatically, but this trick works:
- In the Watch panel add
(class_exists('MyClass') ? (new ReflectionClass('MyClass'))->getStaticProperties() : null)
- Workable Solution: Watch a Reflection snapshot of the class
- Add this to your Watch panel:
(new ReflectionClass(MyClass::class))->getStaticProperties()
- This will display all static properties as an array that you can expand.
- Add this to your Watch panel:
- Optional: include constants and methods too
- If you want all class metadata, add this instead:
new ReflectionClass(MyClass::class)
- You will get:
- class name
- parent class
- interfaces
- constants
- static properties
- methods
- attributes
- Everything — fully expandable in the Watch pane.
- If you want all class metadata, add this instead:
Why Reflection works
- A class is not a runtime value you can “watch,” but Reflection lets you create an object representing the class.
- That object is watchable — so your IDE can display all its properties.
View Object Variables (Watch)
This is just the same as viewing Static Variables but with the following format:
$this->app->components->payment->PaymentMethod                        - This shows all of the variables of the object
$this->app->components->payment->PaymentMethod->$creditnote_details
Execution has paused, now open where the watch condition was matched?
I have not verified if this method works or if it is made up by AI
if the watch expression matched and execution paused, then VSCode should already be stopped at the line of code where the condition was met, or just before it, depending on when the expression was evaluated.
To find where in the code this happened, when execution has paused:
- Look at the Editor:
- VSCode should automatically jump to the file and line where execution paused.
- This is where the watch expression was true during execution.
- Check the Call Stack Panel:
- On the left in the "Run and Debug" sidebar, open the Call Stack section.
- This shows the current and previous functions/methods called.
- Click the top frame (usually bold) — this is where execution is paused.
- If not on top, click through frames until you find the one where your variable appears.
- Use the Variables Panel:
- Under "Locals", "Globals", or "Superglobals", you can find your variable.
- Hover over it or click to expand — this helps confirm it’s the correct scope and line.
- Use the Debug Console:
- At the bottom panel, go to the Debug Console and type:
where
- Or check the current file and line via the stack:
bt
- (These commands may work better in Xdebug CLI, but the Call Stack tab in VSCode is your main guide.)
- At the bottom panel, go to the Debug Console and type:
- If VSCode Did Not jump to the right line automatically (rare but can happen), try:
- Clicking the Call Stack topmost frame.
- Hitting
Ctrl+Shift+Y(or View > Debug Console) to check the output. - Use Step Over / Step In to advance execution a few lines if paused mid-function.
Break Points
With xdebug_break()
You simple add this function into your code and when it is called, it instanciates a breakpoint and causes the execution to pause.
- How to create
- Create breakpoints in VSCode
- Use
xdebug_break()within your code to force a break.
Standard Breakpoints
You simple create a breakpoint on your code using the GUI of VSCode and execution is paused at this point.
Conditional Breakpoints
Example Conditions
$payment_id == 90
$payment->id == 90
Payment::$payment_details['payment_id'] == 90
Payment::$payment_details['payment_id'] == true
Payment::$payment_details['payment_id'] == false
isset($payment['id']) && $payment['id'] == 90
How To Use a Conditional Breakpoint
- Find places in your code where a variable (any you suspect) might be set or passed. Start in relevant classes, views, or controllers.
- Click the gutter next to a suspect line (this sets a regular breakpoint).
- Right-click the red dot → Edit Breakpoint...
- Set a condition, like:
$template === 'classic-doors'
Or if unsure of the variable name, use:
strpos($template ?? '', 'classic-doors') !== false
- Save and run the debugger
- Result:
- When that condition is
true, Xdebug pauses, and VSCode opens the exact file/line where it matched. - You can now inspect the stack, code, and variable state.
- When that condition is
Practical Examples / Methods
To get Xdebug in VSCode to pause (break) when any variable equals classic-doors, you can follow one of these approaches depending on your version of Xdebug and PHP:
- Method 1: Use a Conditional Breakpoint in VSCode
- If you know where the variable might be assigned (or checked), set a conditional breakpoint:
- Open the PHP file where variables might be set or passed.
- Click in the gutter next to the line where the variable is assigned or used.
- Right-click the red dot → Edit Breakpoint
- Enter the condition, for example:
$variable === 'classic-doors'
or
$pageTemplate === 'classic-garage-doors'
- Make sure the variable is in scope at the line you set the breakpoint.
- If you know where the variable might be assigned (or checked), set a conditional breakpoint:
- Method 2: Set a Watch Expression
- Go to the "Run and Debug" panel on the left.
- Expand the "WATCH" section.
- Add an expression like:
$someVariable === 'classic-doors'
- This won't pause execution, but will show you when it's true — combine this with stepping through relevant code.
- Method 3: Use xdebug_break() in Code (Temporary Debug Hook)
- Add the code where needed:
if ($someVariable === 'classic-doors') { xdebug_break(); // Forces a debug pause if Xdebug is connected } - Then reload the page or trigger the code path — it will stop here.
- Add the code where needed:
Tracing
Function Trace - Worked Example - Show in what order WordPress files are loaded
- Q: I want a list, in order, of all files loaded by WordPress so I can see how it is loading to help me better understand an issue I am having with a website.
- A: If you're specifically trying to trace all the files that WordPress loads in order, Xdebug can give you exactly that, but not via the Call Stack in VSCode, because that only shows function calls at the point of a breakpoint. What you want is a file inclusion trace.
Common
This is required for all methods.
- Enable the Trace mode in php.ini by adding the `trace` to the allowed modes
xdebug.mode = trace
xdebug.mode = develop,debug,trace
- Xdebug: Documentation - All settings - mode
- trace
- Enables the Function Trace and Flame Graphs features.
- The former allows you record every function call, including arguments, variable assignment, and return value that is made during a request to a file.
- The latter can be used to visualise certain performance characteristics.
- trace
- Xdebug: Documentation - All settings - mode
- Configure the output directory (pick one)
xdebug.output_dir="D:\websites\tmp\site.trace"
xdebug.output_dir="D:\\websites\\tmp\\site.trace"
xdebug.output_dir="D:/websites/tmp/site.trace"
xdebug.output_dir="/tmp/site.trace"
- The log file (*.xt) will be created in the specified location (e.g.
D:\websites\tmp\site.trace.xt) - Double-backslashes
\\or single-quoted forward slashes/both work.
- The log file (*.xt) will be created in the specified location (e.g.
- Optionally you can also add:
xdebug.show_error_trace=1
xdebug.show_exception_trace=1
- These help with displaying traces on exceptions/errors.
- Xdebug: Documentation - All settings - integer xdebug.show_error_trace - When this setting is set to 1, Xdebug will show a stack trace whenever an Error is raised - even if this Error is actually caught.
- Xdebug: Documentation - All settings - show_exception_trace - When this setting is set to 1, Xdebug will show a stack trace whenever an Exception or Error is raised - even if this Exception or Error is actually caught.
Method 1 - Via Request Trigger
This method is the easiest and allow you to turn it on and off very quickly, however your will end up tracing the whole application.
Instructions
- Make sure the common steps above are completed.
- Install one of the `Browser Plugins` from above.
- Enable `Trace` in the plugin.
- Load your page.
- Examine your Trace file in the defined location.
Method 2 - Explicitly by Code (xdebug_start_trace() & xdebug_stop_trace() )
This method can be useful for tracing particular sections of code.
Instructions
- Make sure the common steps above are completed.
- Add this to the very top of your wp-config.php or index.php (or even better, a custom MU plugin):
xdebug_start_trace('/tmp/wp-trace'); - Then after the request, you’ll get a trace file like:
/tmp/wp-trace.xt
- This file will contain a line-by-line trace including:
include,require,include_once, etc.
Function calls
Timestamps and memory usage
- The trace will look like this:
0.0001  104856  -> require_once(/var/www/html/wp-load.php)
0.0023  105321  -> require_once(/var/www/html/wp-config.php)
0.0032  106544  -> include_once(/var/www/html/wp-settings.php)
0.0045  107120  -> require_once(/var/www/html/wp-includes/load.php)
- You’ll get a full ordered list of everything WordPress is loading and when.
- This file will contain a line-by-line trace including:
- Stop the Trace
- You can stop the trace explicitly:
xdebug_start_trace(); - This will output a file to the folder defined by `xdebug.output_dir` or xdebug_start_trace('<location>'); - You can specify a location for the trace file. Accepts same formats as `xdebug.output_dir` - Or let it stop automatically when the script ends.
- You can stop the trace explicitly:
- Examine your Trace file in the defined location.
Notes
- Xdebug: Documentation - Function Trace - xdebug_start_trace - Start tracing function calls from this point.
- Xdebug: Documentation - Function Trace - xdebug_stop_trace() - Stops the current function trace.
debug_backtrace()
These inbuilt PHP functions allow you to Log Stack Traces.
- PHP: debug_backtrace - Manual - Generates a backtrace
var_dump(debug_backtrace());
- PHP: debug_print_backtrace - Manual - Prints a backtrace
debug_print_backtrace(DEBUG_BACKTRACE_IGNORE_ARGS);
REST API (i have some links)
HTTP
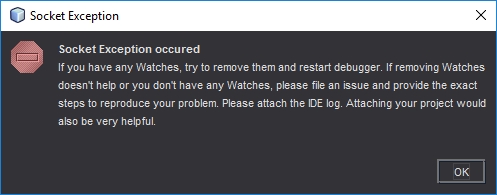
Getting Xdebug, Xampp and Netbeans to work together in Windows can be a tricky thing and I want to address that here. These instructions will get debugging working all on the same PC and IP.
A symptom of a PC that is not setup correctly is this Netbeans Socket Exception error. You get this error when Netbeans cannot communicate with Xdebug and is usually because you are running them both on the same computer and therefore IP so the traffic routing is getting mixed up. It could also because something else is running on the debug port you have selected.
These Settings Work
These settings are what I am using now and work well.
Windows
- You need to set a static IP on your ethernet adapter (or wifi)
php.ini
- Use your static IP to set xdebug.remote_host. Setting a static IP seems to fix most connecion issues. xdebug does not like 127.0.0.1 it works sometimes but can be problematic.
- Swapping xdebug.remote_port to 9001 helped when xdebug just stopped working. The default is 9000.
- Disable output_buffering in your php.ini by altering/uncommenting the following line
output_buffering = Off
- Add the following code to the end of your php.ini file.
[XDebug]

zend_extension="D:\websites\php\ext\php_xdebug.dll"
;zend_extension="D:\websites\php\ext\php_xdebug-2.5.4-5.6-vc11.dll"
xdebug.idekey = vsc
xdebug.profiler_append = 0
xdebug.profiler_enable = 0
xdebug.profiler_enable_trigger = 0
xdebug.profiler_output_dir = "d:\websites\tmp\xdebug"
xdebug.profiler_output_name = "cachegrind.out.%t-%s"
xdebug.remote_enable = 1
xdebug.remote_autostart = 0
xdebug.remote_connect_back = 0
xdebug.remote_host = "192.168.1.160"
xdebug.remote_port = 9001
xdebug.remote_handler = "dbgp"
xdebug.remote_mode = req
xdebug.remote_log = "d:\websites\tmp\xdebug\xdebug_remote.log"
xdebug.show_local_vars = 9
xdebug.trace_output_dir = "d:\websites\tmp"

;xdebug.show_exception_trace = 1
Minimum working settings
These are the minimum settings I have found to work but are here only for reference.
[XDebug]

;zend_extension="D:\websites\php\ext\php_xdebug.dll"
zend_extension="D:\websites\php\ext\php_xdebug-2.5.4-5.6-vc11.dll"
xdebug.remote_enable=1
xdebug.remote_handler=dbgp
xdebug.remote_mode=req
xdebug.remote_host=192.168.1.160
xdebug.remote_port=9001
xdebug.idekey=vsc
Netbeans
(Tools --> Options --> PHP --> Debugging)
- Debugger Port: 9001
- Session ID: vsc
- Maximum Data Length: 2048 - I think this is the default
- Stop at First Line: off
- Watches and Balloon Evaluation: All off
- Show Requested URLs: off
- Show Debugger Console: On
Browser
You need to send a trigger to Xdebug via your browser to trigger the debugger. You can send the trgger via GET/POST but you need a plugin for this.
- Firefox
- The easiest Xdebug – Add-ons for Firefox
- There are many others....
- Google
- Xdebug helper - Chrome Web Store
- There are many others....
Test Debugger is working
Now you have configured your system as above you need to test it before you can rely on it.
- Set a breakpoint in Netbeans on the index.php (or a PHP file that is parsed) in your software project, preferably one before the content is displayed. (or you can enable the ‘Stop at First Line’ option in the Netbeans config
- Start debugging in Netbeans
- Open your project in a chrome browser with the xdebug helper plugin enabled
- If the browser and Netbeans stop at the breakpoint, everything is working
Diagnostics
Things that Might help
If xdebug does not work straight away then trying these things might help.
- could disabling ipv6 in the network adapter help? because xampp has issues with ipv6
- xdebug might fail if you have multiple version of xampp running
- Localhost is mapping to ::1 and not 127.0.0.1
- Not all lines can act as breakpoints, these are displayed as cracked breakpoint markers in Netbeans. These breakpoints will not work because Netbeans does not like them. To fix this yoou should choose another breakpoint.
- Run the Xdebug on another server which has another IP
- Get the latest dll from xdebug site (i.e. php_xdebug-2.5.4-5.6-vc11.dll)
- Comment out any zend extensions
- Some people use port 9001 when they have issues with 9000.
Test the port is not already in use - dbgtest.php
This code is taken from 21.4.2 How to Set Up XDebug | Oracle
<?php
$address = '127.0.0.1';
$port = '9000';
$sock = socket_create(AF_INET, SOCK_STREAM, 0);
socket_bind($sock, $address, $port) or die();
socket_listen($sock);
$client = socket_accept($sock);
echo "Connection established: $client";
socket_close($client);
socket_close($sock);
?>
However I found this slightly better version from dbgtest.php · GitHub
<?php
// adapted from https://blogs.oracle.com/netbeansphp/entry/howto_check_xdebug_installation
$address = $argv[1] ?: '127.0.0.1';
$port = '9000';
$sock = socket_create(AF_INET, SOCK_STREAM, 0);
socket_bind($sock, $address, $port) or die();
echo "Listening to $address:$port\n";
socket_listen($sock);
$client = socket_accept($sock);
echo "Connection established: $client\n";
socket_close($client);
socket_close($sock);
- Create a php file with the code above called dbgtest.php and put it in the htdocs folder of your xampp server
- Change the port to 9001 if that is the port number you are using/diagnosing
- Enable sockets - extension=php_sockets.dll
- only be need for the test script
- You enable this by uncommenting the appropriate line in the php.ini
- if you do not enable this you will get this error
Call to undefined function socket_create()
- Close Netbeans if that is running.
- Restart Xampp
- Run the script
If there is something running on this socket you will get an error as shown below. This shows that some other process is using the port 9000.
Warning: socket_bind(): unable to bind address [10048]: Only one usage of each socket address (protocol/network address/port) is normally permitted. in D:\websites\htdocs\dbgtest.php on line 5
Workarounds
These are a few workarounds I tried and might work for you. These are not designed to be a permanent fix.
Method 1
- Make sure netbeans and xampp are not running
- Put the basic xdebug settings in php.ini
- Enable extension=php_sockets.dll in php.ini
- Run xampp
- Put a copy of the oracle script in your Webroot and run it. This causes xampp to open socket on 9000
- Now open and run NetBeans debugging
* I am not sure if you need to do the IP fix aswell for this to work. It is all caused by routing issues on the loopback system of the PC. Or sockets might be needed.
Method 2
- Turn of netbeans debugging (leave netbeans open)
- Run the dbgtest.php to allow xampp/xdebug to grab the port
- Now start netbeans debugging
Method 3 - (if working and then stops for no reason)
- Close Netbeans, Xampp and browsers
- Restart them all